Welcome
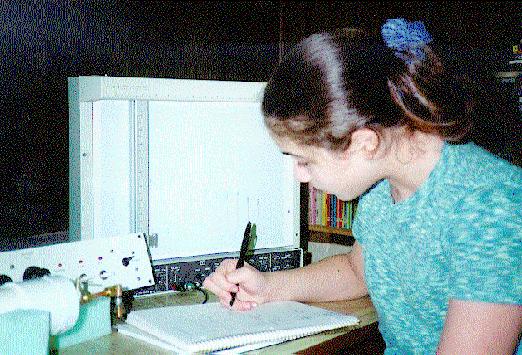
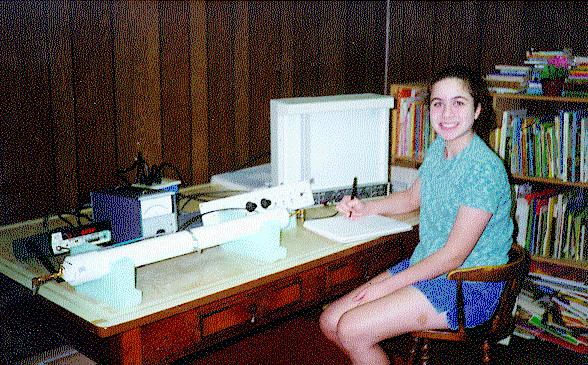
My name is Marianne Gualtieri. I did a science fair project on the measurement of the speed of sound in gases when I was a 9th-grade student at Villa Walsh Academy in Morristown, New Jersey. I measured the speed of sound for air, argon, carbon dioxide and propane by observing the frequencies of the acoustic resonance modes in a closed pipe. This is a summary of my project which won first place in the Physics category at the 1998 science fair. Click here to view a photograph of me and the measurement apparatus, and read our disclaimer .
Safety Precautions
I observed certain safety precautions while building the apparatus and using certain gases.
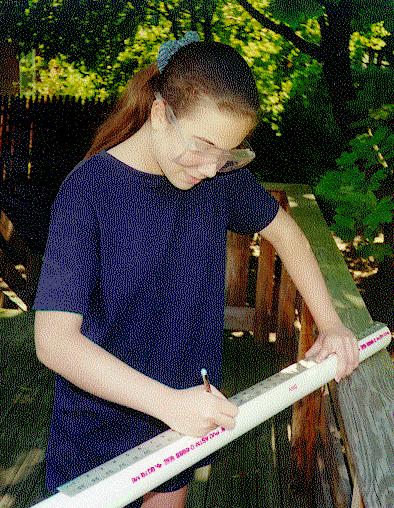
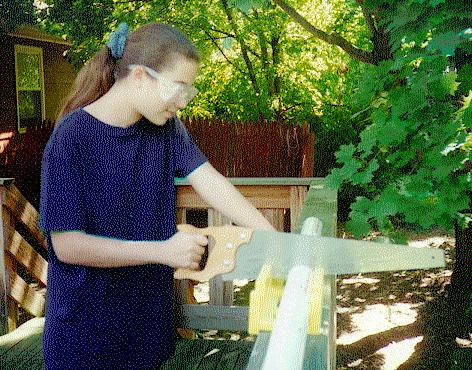
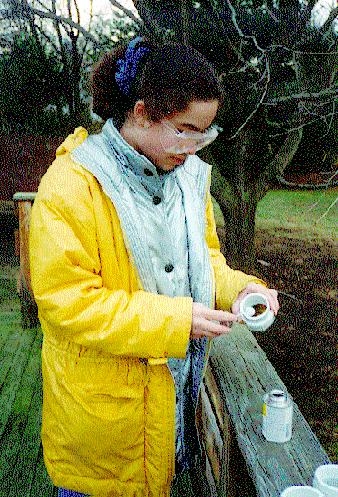
Safety Glasses - It is important to wear safety glasses while doing any experimetal work. The best type to use are ones with side shields. Here are photographs of me with safety glasses when I was measuring, cutting, and gluing the PVC pipe used for the resonant tube in the experiment (as explained below). It was necessary to do the gluing outside, since the PVC pipe glue contains a strong solvent.
Gases - When working with compressed gases, watch out for pressure build-ups that can cause your apparatus to burst. My father works in a laboratory, and he helped me with the gases. He filled the apparatus with gas at his laboratory and took the necessary safety precautions. Argon, carbon dioxide and propane are aphixiating gases, which means that they will choke you my reducing the oxygen you breath. Pure oxygen gas can cause spontaneous combustion of organic materials like oil. Oxygen systems should not have oiled valves. Propane, which is used in plumber's torches, is flammable, and it is explosive when mixed with oxygen. For safe experiments at home, air would be the easiest gas to use. You can get carbon dioxide gas by evaporating dry ice in a thin bag (thin, so that it can burst without any problem if there's a pressure build-up). Just make certain that the room is well ventillated. For further information about gas safety, you can visit the Canadian Centre for Occupational Health and Safety .
Electricity - This project used only low voltage signals, like the kind for earphones, speakers and CD players, but the meters and other equipment plugged into the wall outlet. Always use three-prong grounded plugs and outlets with equipment.
Purpose of Experiment
This experiment was done to test the hypothesis that the speed of sound will be slower in denser gases, since the heavier molecules will be harder to move.
Principle of Speed of Sound Measurement
This experiment found the speed of sound by measuring the frequencies of the resonance modes in a closed pipe. Sound is a pressure wave, and each frequency of sound has a certain wavelength associated with it. The figure below illustrates the idea of wavelength.
| Sound is a pressure wave. The distance between consecutive points of highest or lowest pressure is the wavelength. |  |
When there is a sound wave in a closed pipe, and there is a whole number of wavelengths in the pipe, the sound intensity will be higher because the sound wave reflected back from one end of the pipe will match the sound wave in the pipe. If there is not a whole number of wavelengths in the pipe, the reflected wave will interfere with the wave in the pipe, and there will be less sound intensity. The following figure shows a resonance pattern in a closed pipe four wavelengths long.
 |
There is a simple formula for finding the speed of sound when you know the frequencies where the intensity is greatest,
The diagram below shows the basic construction of the speed of sound apparatus. There is closed pipe filled with gas with a speaker at one end and a microphone at the other end. An audio oscillator signal is wired to an amplifier to drive the speaker with sound frequencies from zero to about 4,000 cycles-per-second, or Hertz (named after a famous Physicist). There is a frequency counter to measure the frequency, a sound meter to measure the sound intensity from the micrphone, and a chart recorder to show how the intensity changes with frequency. Although the chart gives a quick idea of what's happening, I used the frequency counter for more accurate measurement of the places where the sound intensity was highest. It may be possible to program computer sound cards to produce and analyze the frequency signals. In this way you wouldn't need all this equipment, but you would need to be a computer expert.
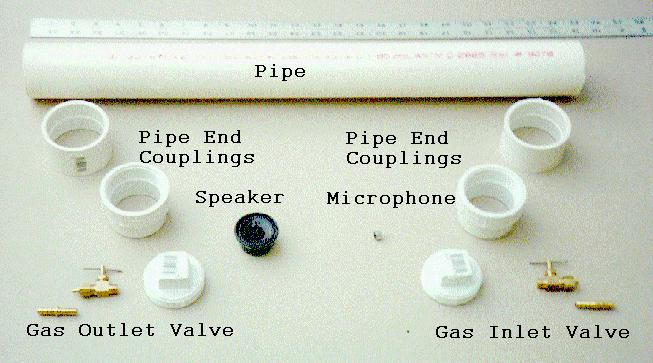
This is a photograph of the pipe (it was a two-inch PVC plumbing pipe), its end fittings, the speaker, the microphone, and the valves. My father helped me mount the speaker, microphone, and valves on the end caps, and seal everything so that it would be airtight. Before you seal the system, do an accurate measurement of the distance from the microphone to the speaker. Since the speaker is conical, I took the midpoint of the cone for the measurement. The distance in my pipe was about two feet, but shorter and longer pipes will work (see the equation above).
Gas filling is an easy procedure. The gas is brought to one of the valves (the inlet) with a rubber tube, and the other valve (the outlet) is left open and vented with another tube through a window outside the house. The gas pressure is set very low, just a little more than atmospheric pressure, but the flow is enough to displace (push out) the old gas in the resonance pipe after a few minutes. You can verify that the resonance pipe contains 100% of the new gas by taking measurements after five minutes filling, ten minutes fillng, etc. You will see that the speed of sound in the same. After filling, shut both valves to keep the gas in the resonance tube. Don't flow oxygen into a propane filled pipe, or propane into an oxygen filled pipe! Flush the pipe with air from a bicycle pump first. Use the same precaution for other dangerous combinations of gases. Gas filling is definitely a place where you need supervision by a technically qualified adult, like your science teacher.
The following is an example of the experimental data for air. This chart is a signal trace of the sound intensity as a function of frequency from 0 to 4200 Hz, and it shows the acoustic resonances in the air column of the closed pipe. One small problem was that the speaker had its own resonance at low frequencies, and this interferred with the resonance modes of the pipe. You can see this in the graph. There is also a small resonance of the microphone at very high frequencies. The frequencies of the peaks are used in the equation.
Here is a summary of the experimental data for all the gases. The graphs show the trend in the calculated speed of sound at each mode. If everything was perfect, the graphs would be a level line, but the speaker resonance at low frequecies spoils some of the accuracy. You can click on the graphs to see the real data tables. I calculated the mean and standard deviations of the the data sets using the Excel spreadsheet program. The standard deviation shows the measurement error, and small numbers here are always good. I also recorded the temperature and barometric pressure which might have caused changes in the speed of sound. Further research showed that only large changes in temperature and pressure would cause a measureable effect.
Click on the graph to view the data.
Click on the graph to view the data.
Click on the graph to view the data.
Click on the graph to view the data.
The following table shows the density of the gases used in this experiment, the experimentally determined speed of sound, and the statistical error of the measurement.
The hypothesis that the speed of sound will be slower in denser gases was confirmed (see graph).
David Halliday and Robert Resnick, Physics for Students of Science and Engineering, John Wiley & Sons, Inc. (New York, 1960). Arthur Beiser, Modern Technical Physics, The Benjamin/Cummings Publishing Company, Inc. (Menlo Park, CA, 1983). Dwight E. Gray, Ed., American Institute of Physics Handbook, McGraw-Hill Book Company (New York, 1972). Herman Ebert, Physics Pocketbook, Interscience Publishers (John Wiley & Sons, Inc., New York, 1967).
See my other science fair project FM Radio Detection of Meteors .
Comments and technical questions can be addressed to me care of my father, Devlin Gualtieri, at Honeywell Laboratory, Morristown, NJ.
Apparatus
Gas Filling
Resonance Data
12/19/97, air, Temperture = 70 F, Barometer = 29.72, L = 25.44 inches, Mean = 1039.70 feet/second, Std. Dev. = 22.35 feet/second
12/14/97, Argon, Temperature = 70 F, Barometer = 29.78, L = 25.44 inches, Mean = 957.84 feet/second, Std. Dev. = 20.29 feet/second
12/18/97, carbon dioxide, Temperature = 70 F, Barometer = 29.80, L = 25.44 inches, Mean = 811.00 feet/second, Std. Dev. = 23.53 feet/second
12/13/97, Propane, Temperature = 70 F, Barometer = 29.62, L = 25.44 inches (2.120 feet), Mean = 771.47 feet/second, Std. Dev. = 21.30 feet/second
Summary and Conclusions
Density of Gases and Experimentally Determined Speed of Sound.
Gas
Density (kg/m3)
Speed (feet/sec)
Standard Deviation (feet/sec)
Air
1.2929
1039.7
22.4
Argon
1.7837
957.8
20.3
Carbon Dioxide
1.977
812.4
23.0
Propane
2.009
771.5
21.3
Bibliography and Links
Copyright © 1999 D. M. Gualtieri, All Rights Reserved.
Last Update: 6-23-2001