Mapping the Milky Way
October 20, 2016
Cartographers (
map makers) in the
Age of Discovery made successive
approximations to the outline of the
New World based on successive
explorations. When the observations of
Italian explorer,
Amerigo Vespucci (1454-1512), indicated that the
land mass visited in those early years was not the
eastern coast of
Asia but a
new continent, cartographer,
Martin Waldseemüller (1470-1520),
commemorated this by naming the continent "
America" in a map called the
Universalis Cosmographia.

Amerigo Vespucci (1454-1512).
Vespucci sailed far enough south to observe the constellations, Centaurus and Crux (the Southern Cross), as well as the Coalsack Nebula.
These were known to the ancient Greeks, and they were described by Ptolemy, but they had disappeared from northern skies after about 400 AD as a consequence of the axial precession of the Earth.
(Via Wikimedia Commons.)
Just as better knowledge of the New World allowed its maps to become more detailed in time, the same was true for our home
galaxy, the
Milky Way. Before the
20th century, it wasn't realized that the Milky Way was a galaxy, or that such a thing as a galaxy even existed.
A turning point came in
1920 when two prominent
astronomers of their time,
Harlow Shapley and
Heber Curtis,
debated the nature of the Milky Way, the
nebulae (as galaxies were then known), and the extent of the
universe. Curtis argued that the
Andromeda Nebula was actually an external galaxy, but direct evidence for this would come only later with advances in
technology.
Edwin Hubble was able to
photograph some nebulae in detail to show individual
stars. His further observations of
Cepheid variables allowed his
estimate of nebular distances that were clearly outside the dimension of the Milky Way. His distance estimate for the Andromeda Nebula, now known as the
Andromeda Galaxy, was 275,000
parsecs (900,000
light years). The present estimate is 778,000 parsecs (2.54 million light years). The Milky Way is only about 50,000 parsecs (160,000 light years) in
diameter.
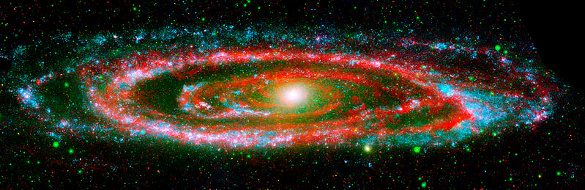
Composite image of the Andromeda Galaxy. The image is coded red for 24 μm, green for near-ultraviolet, and blue for far-ultraviolet. I recently viewed the 2016 season premiere of Drunk History. It had a segment about Timothy Leary (1920-1996), and this psychedelic image reminds me of him. As a college student in the 1960s, I heard Leary lecture on two occasions.[2] (NASA/JPL-Caltech/K. Gordon (Univ. of Arizona)/GALEX Science Team image via Wikimedia Commons.)
Knowing the shape of the Milky Way was difficult for two principle reasons. First, much of our galaxy is blocked from view at our vantage point by the massively star-filled
galactic center. Second, the galaxy is not just stars separated by void. It contains a lot of
obscuring dust. While this inhibits observations in
visible light,
radio astronomers soon realized that they could image things that their
optical astronomy colleagues could not.
In 1954,
Dutch astronomers,
Jan Hendrik Oort (1900-1992),
Hendrik C. van de Hulst (1918-2000), and C.A. Muller, published the
spiral structure of the Milky Way Galaxy using observations of the 21
cm wavelength (1.42
GHz)
neutral hydrogen emission line. They found that
radio emissions at this wavelength passed unabsorbed through regions that obscured optical observation. In an example of
swords to ploughshares, they used
World War II surplus Radar equipment located at
Kootwijk, The Netherlands.
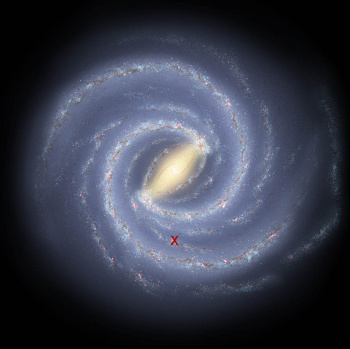
"X" marks the spot.
Earth's location is shown by an "X" in this artist's conception of the spiral structure of the Milky Way Galaxy.
The structure of our spiral has only been elucidated recently.[3]
(Modified NASA/JPL-Caltech/R. Hurt (SSC/Caltech) image ssc2008-10a.)
It's been sixty years since that first mapping of the Milky Way spiral arms. Since then, astronomers have launched
space telescopes sensitive to wavelengths of light outside the visible spectrum, and radio astronomers have built larger
antennas with much more
sensitive radio receivers. All these technologies have improved our knowledge of the Milky Way. The latest map of the Milky Way, based on the first year's observations of the
Gaia spacecraft of the
European Space Agency, has just been released.[4-7]
The Gaia spacecraft, launched at the end of 2013, is on a five-year mission to measure the positions and
proper motions of billions of stars. The Milky Way may contain as many as 400 billion stars. At this time, the positions of 1.1 billion stars have been measured, as well as the proper motions of two million stars.[5]
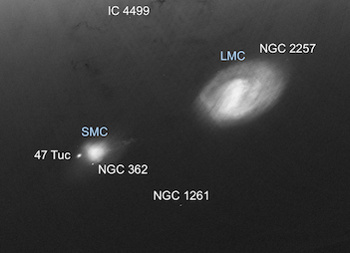
Detailed portion of the Gaia star map.
Shown are the Large Magellanic Cloud (LMC) and the Small Magellanic Cloud (SMC).
(ESA/Gaia/DPAC copyrighted image.)
This preliminary map was built from data collect by Gaia from July, 2014, to September, 2015.[5] Gaia's mission was to extend the observations of the
Hipparcos satellite, launched on a four year mission in August of 1989.[6] This name of this satellite is based on that of the
Greek astronomer,
Hipparchus of Nicaea, who compiled the first stellar catalog from observation with the unaided eye.[7] Hipparcos was able to determine the
brightness, position, and proper motion of about 100,000 stars, after correcting for a significant problem with its orbit.[6]
Gaia has a billion
pixel detector capable of seven
micro-arcseconds angular resolution.[6] This detector is composed of 106 individual
charge-coupled devices (CCD).[7] As can be imagined, the
data stream from such a detector is considerable, and it amounts to 40
gigabytes per day.[4,7] Just as Hipparcos, Gaia has had its own problems. Stray light getting past its 10
meter diameter
sun shade has posed a challenge for imaging the fainter stars.[4,6] Also, there's been an
icing problem on its
telescope mirrors.[4]
At this point in its mission, Gaia has deduced the brightness, position and proper motion of 1,142 million stars.[7] The position measurements will allow for a
three-dimensional map of our galaxy.[4] The proper motions were derived with comparison to the
datasets from Hipparcos and
Tycho-2, a
star catalog that lists the 2.5 million brightest stars.[5]
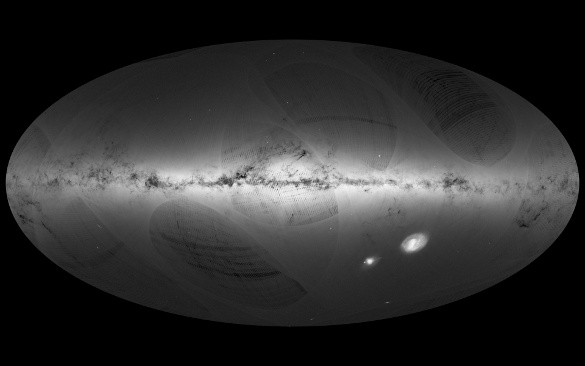
The Gaia star map after the first year of observations. This map doesn't show the stars themselves, but the density of stars.[5] Lighter regions indicate a greater number of stars. The mottled appearance is a data artifact, and it will disappear when all data are compiled. (ESA/Gaia/DPAC copyrighted image. Click for a larger, annotated image.)
Since Gaia's limiting
magnitude is 20, it's not expected to discover any unknown
Solar System objects.[5] It can, however, detect
exoplanets by an
analysis of stellar motions. About 20,000 exoplanets are expected to be discovered this way to add to the present total of 3,000.[5-6] One area in which Gaia excels is the discovery of
variable stars. At this point 3,194 variable stars have been detected, 386 of which are new discoveries.[7]
An updated map is expected in late 2017, and this will push the position accuracy of some stars to 10 micro-arcseconds, very close to the design limit of seven.[4] Spacecraft use star positions for
navigation, and the Gaia catalog would be useful for navigation of the
New Horizons spacecraft as it heads to the
Kuiper belt to encounter
2014 MU69.[5] Gaia's mission will end in mid-2019, but there's a possibility of an extension to 2024 to increase the accuracy of its catalog.[4] One possible follow-up is an
infrared version of Gaia, which would detect the dim
red dwarf and
brown dwarf stars near our Solar System.[4]
References:
- H. C. van de Hulst, C. A, Muller, and J.H. Oort, "The spiral structure of the outer part of the Galactic System derived from the hydrogen emission at 21 cm wavelength," Bulletin of the Astronomical Institutes of the Netherlands, vol. 12, no. 452 (May 14, 1954), pp. 117-149.
- Legend of a Mind was a 1968 song by The Moody Blues. Its opening lines are, "Timothy Leary's dead - No, n-n-no he's outside, looking in." Leary died in 1996, not 1968, so this is an allusion to something else. You can see this song performed in a YouTube video.
- Ye Xu, Mark Reid, Thomas Dame, Karl Menten, Nobuyuki Sakai, Jingjing Li, Andreas Brunthaler, Luca Moscadelli, Bo Zhang and Xingwu Zheng, "The local spiral structure of the Milky Way," Science Advances, vol. 2, no. 9 (September 28, 2016), article no. e1600878, DOI: 10.1126/sciadv.1600878.
- Govert Schilling, "Star-mapping mission shows Milky Way to be larger than thought," Science, September 14, 2016, DOI: 10.1126/science.aah7296.
- Emily Lakdawalla, "Gaia's first galaxy map," The Planetary Society, September 14, 2016.
- Jonathan Amos, "Gaia space telescope plots a billion stars," BBC News, September 14, 2016 .
- Katyanna Quach, "Map to the stars: Gaia's first data dump a piece of 3D Milky Way puzzle," The Register (UK), September 14, 2016.
Permanent Link to this article
Linked Keywords: Cartography; cartographer; map; Age of Discovery; approximation; New World; exploration; Italian; explorer; Amerigo Vespucci; continent; land mass; east; eastern; coast; Asia; Americas; Martin Waldseemüller (1470-1520); memorialization; commemorate; America; Universalis Cosmographia; sailing; sail; south; constellation; Centaurus; Crux; Coalsack Nebula; Ancient Greece; ancient Greeks; Ptolemy; northern hemisphere; Anno Domini; AD; axial precession of the Earth; Wikimedia Commons; galaxy; Milky Way; 20th century; 1920; astronomer; Harlow Shapley; Heber Curtis; Great Debate (astronomy); nebula; universe; Andromeda Nebula; technology; Edwin Hubble; photograph; star; Cepheid variable; estimate; Andromeda Galaxy; parsec; light year; diameter; micrometer; μm; ultraviolet; season premiere; Drunk History; Timothy Leary (1920-1996); psychedelic art; psychedelic; undergraduate education; college student; 1960s; lecture; galactic center; cosmic dust; visible light; radio astronomy; radio astronomer; visible-light astronomy; optical astronomy; colleague; Dutch; Jan Hendrik Oort (1900-1992); Hendrik C. van de Hulst (1918-2000); spiral galaxy; spiral structure; centimeter; cm; wavelength; GHz; neutral hydrogen emission line; radio wave; swords to ploughshares; World War II; surplus; radar; Kootwijk, The Netherlands; Earth; artist; NASA/JPL-Caltech/R. Hurt (SSC/Caltech) image ssc2008-10a; space telescope; antenna; sensitivity; sensitive; radio receiver; Gaia spacecraft; European Space Agency; proper motion; Large Magellanic Cloud; Small Magellanic Cloud; ESA/Gaia/DPAC; Hipparcos satellite; Greek astronomer; Hipparchus of Nicaea; apparent magnitude; brightness; pixel; photodetector; micro-arcsecond; angular resolution; charge-coupled device; data stream; gigabyte; meter; sun shade; icing; reflecting telescope; telescope mirror; three-dimensional; dataset; Tycho-2; star catalog; number density; mottled; artifact; Solar System; exoplanet; mathematical analysis; variable star; navigation; New Horizons spacecraft; Kuiper belt; 2014 MU69; infrared; red dwarf; brown dwarf.